Transport
Transport allows people to move across cities, countries, and continents. It allows us to trade goods and products across the world by road, rail, sea or air.
It has become an essential part of our lives, whether it’s getting to work or school; delivering essential services or necessities to different communities; or connecting people and industries across the world. It’s now a key driver of economic development.
But transport also negatively affects our health and the environment through road injuries and fatalities, air pollution , and CO₂ emissions which drive climate change .
On this page, you can find data, visualizations, and writing on transport patterns across the world, how this is changing, and its environmental impacts.
Related topics
- Trade and Globalization
- Migration
- Tourism
- CO₂ and Greenhouse Gas Emissions
Research & Writing
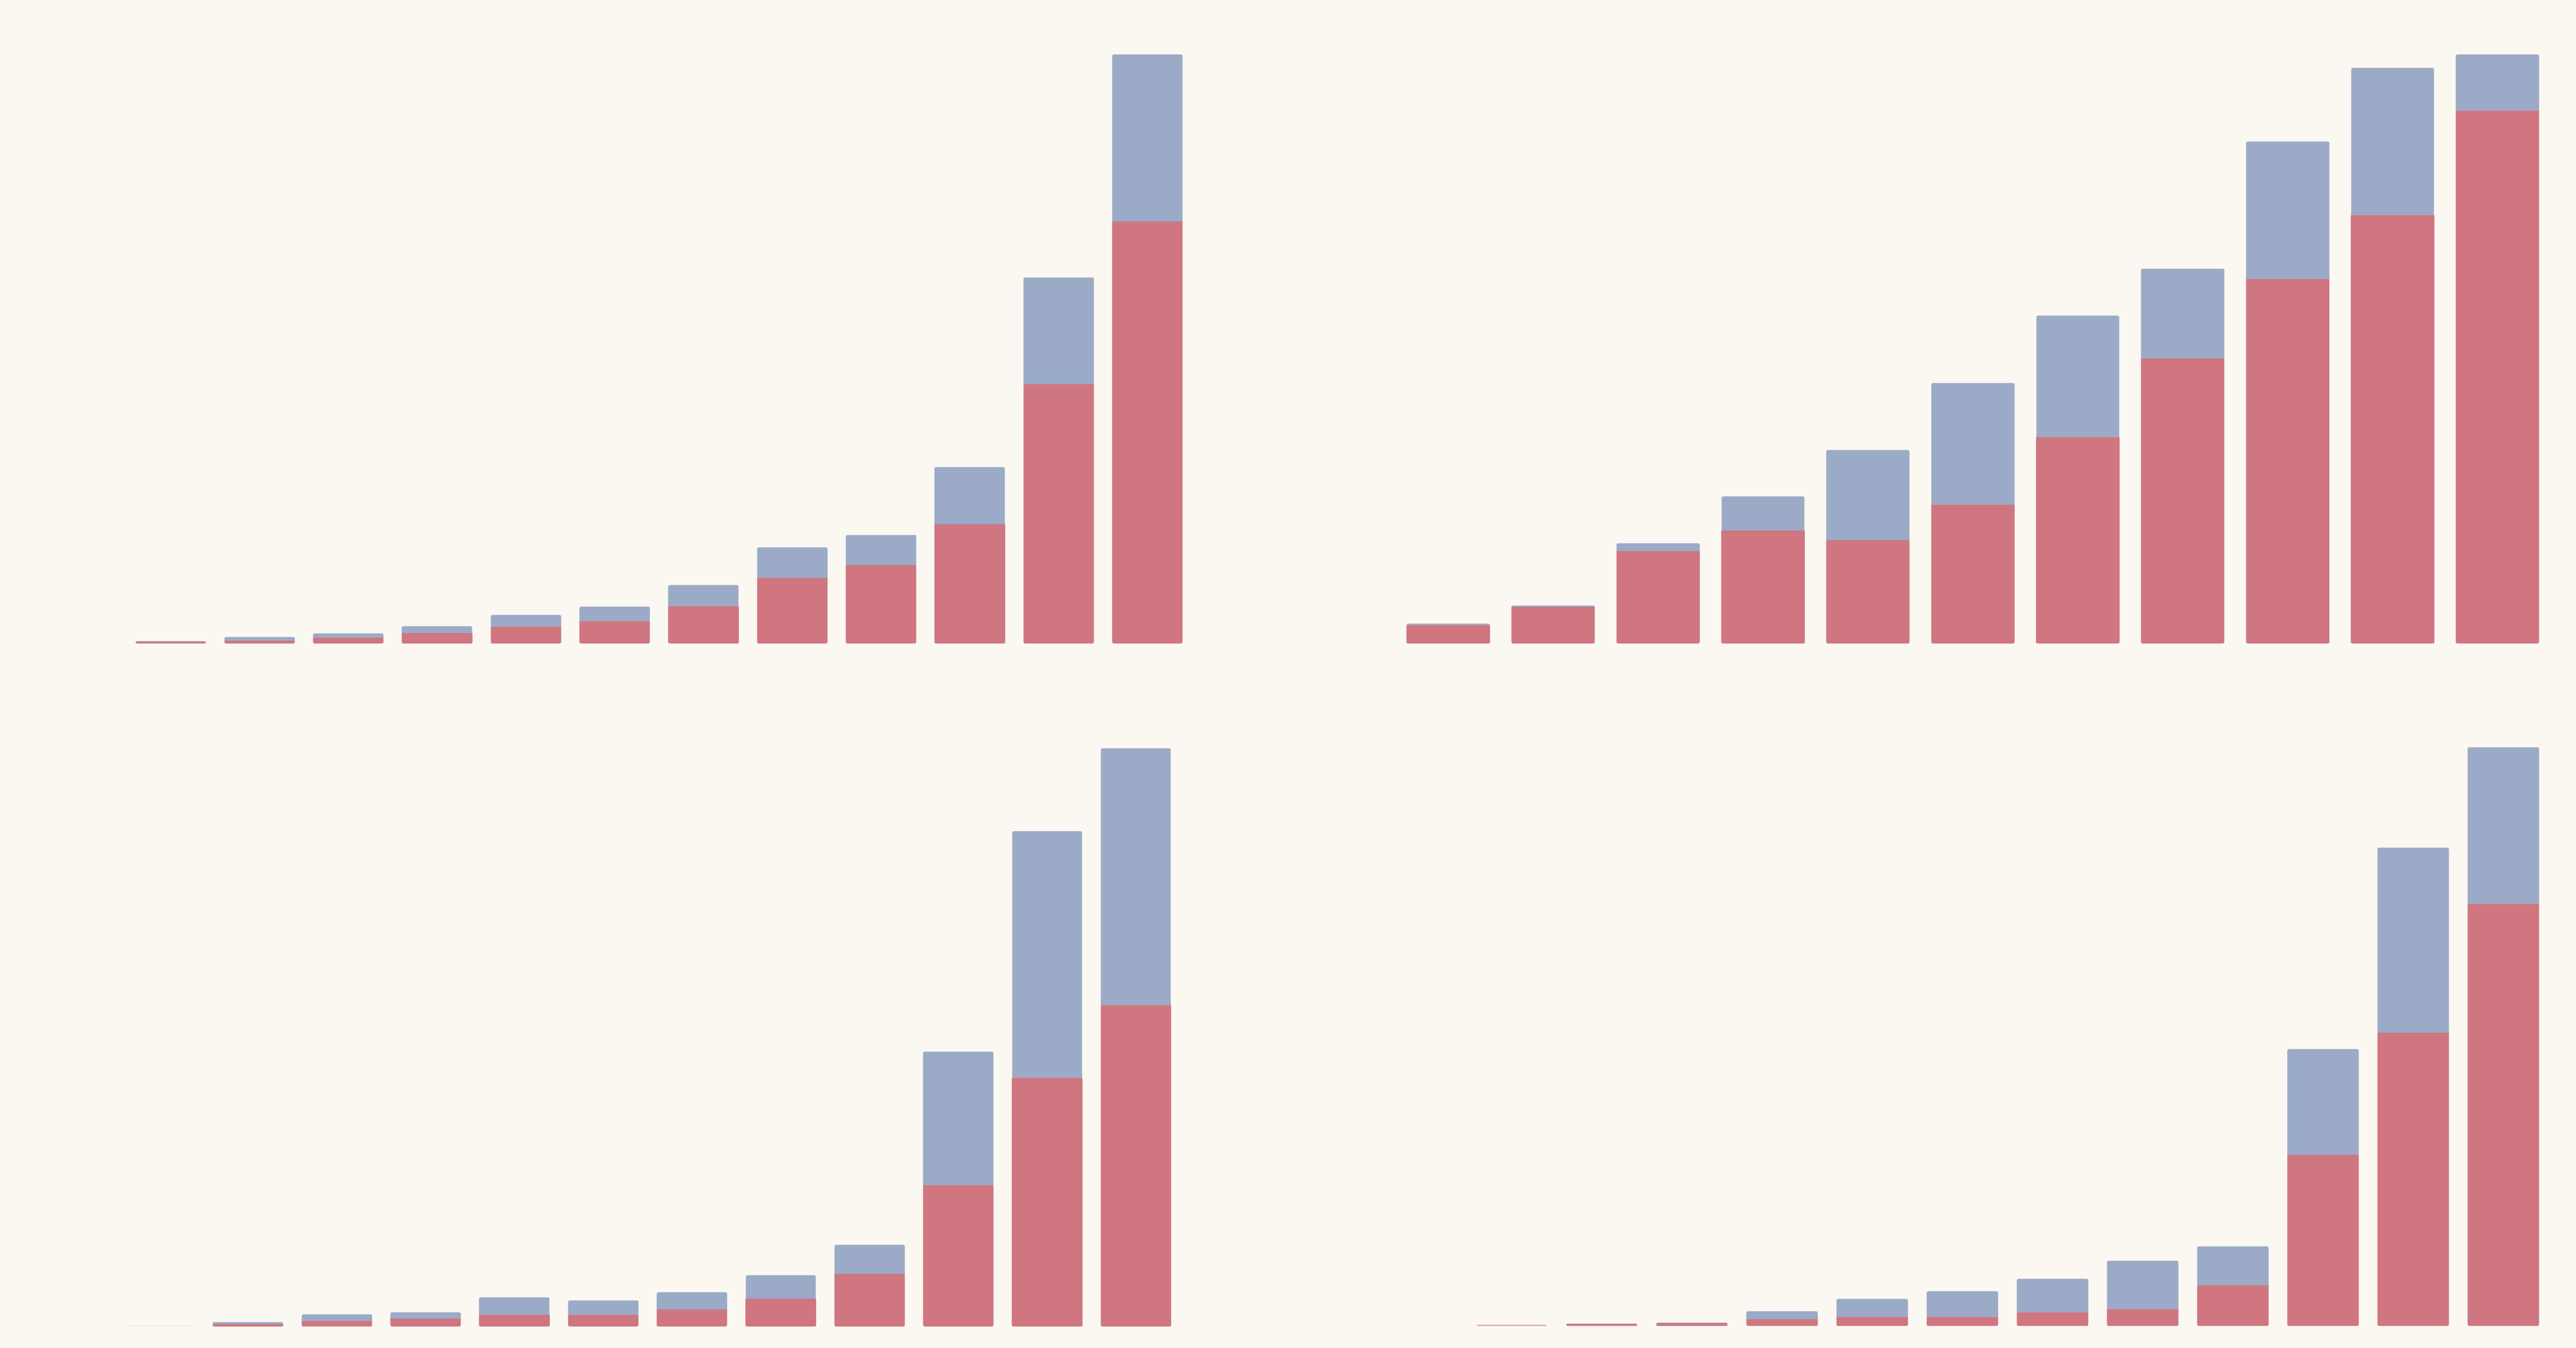
Tracking global data on electric vehicles
Explore data on electric car sales and stocks worldwide.
What share of global CO₂ emissions come from aviation?
Aviation accounts for 2.5% of global CO₂ emissions. But it has contributed around 4% to global warming to date.
How can individuals reduce their emissions from transport?
Transport and CO₂ emissions

Cars, planes, trains: where do CO₂ emissions from transport come from?
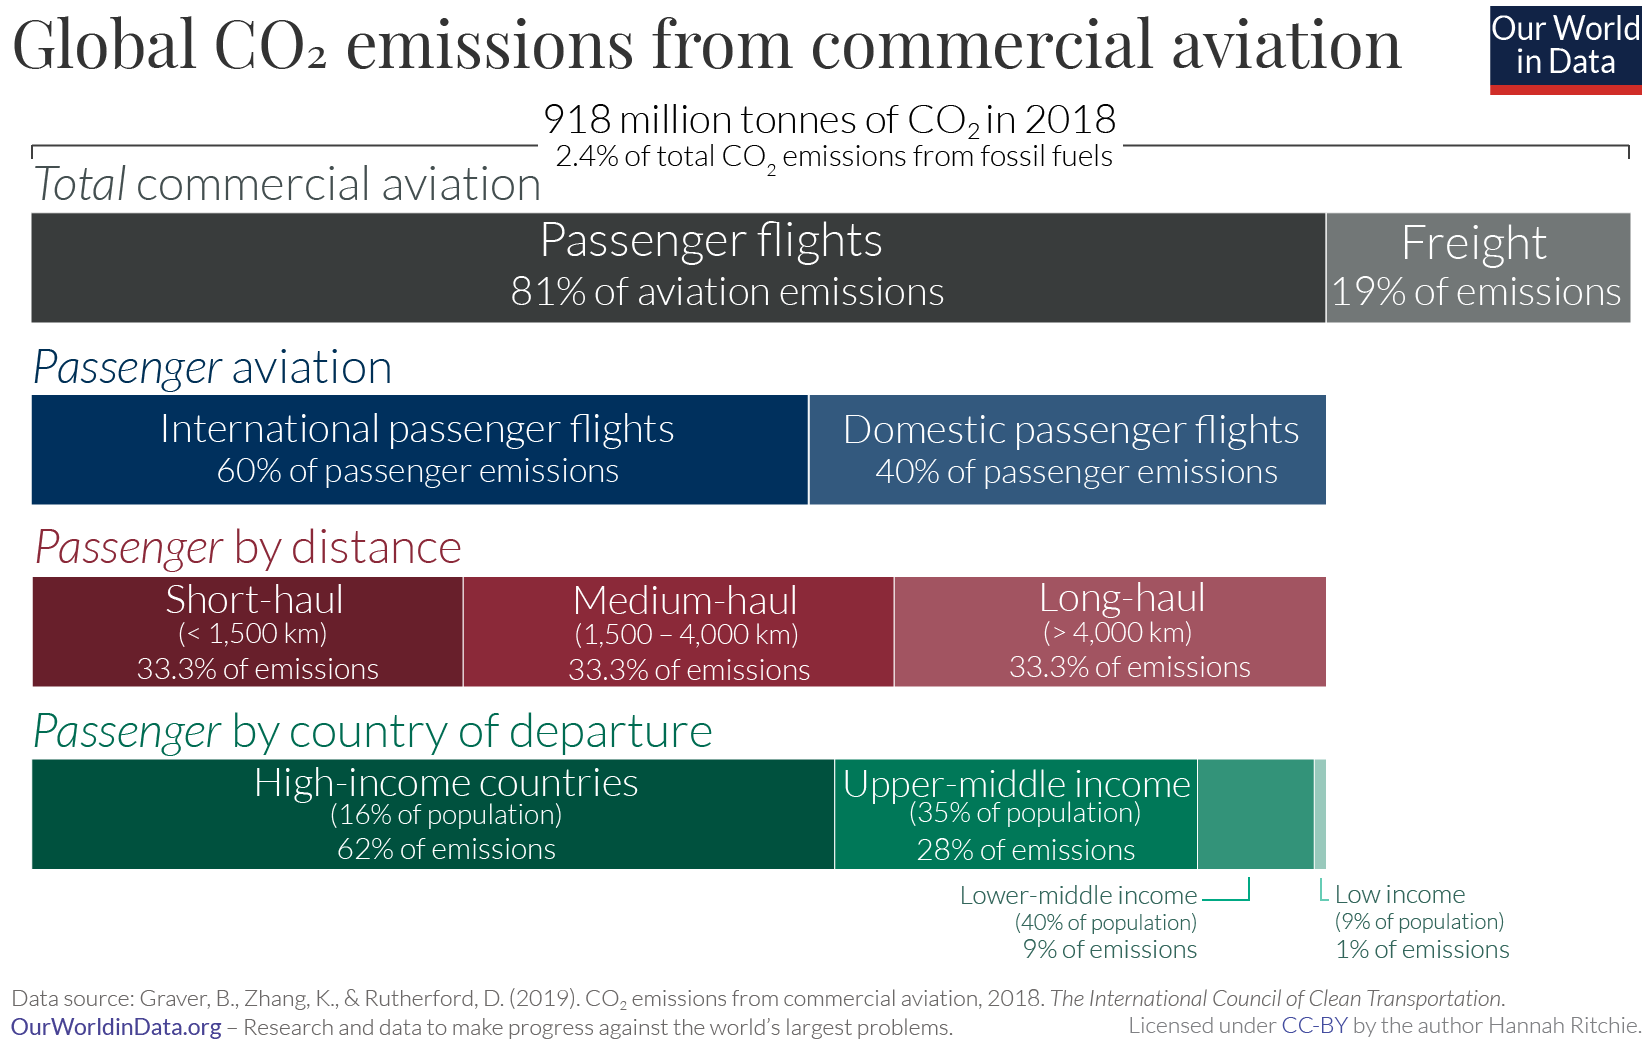
Global inequalities in CO₂ emissions from aviation
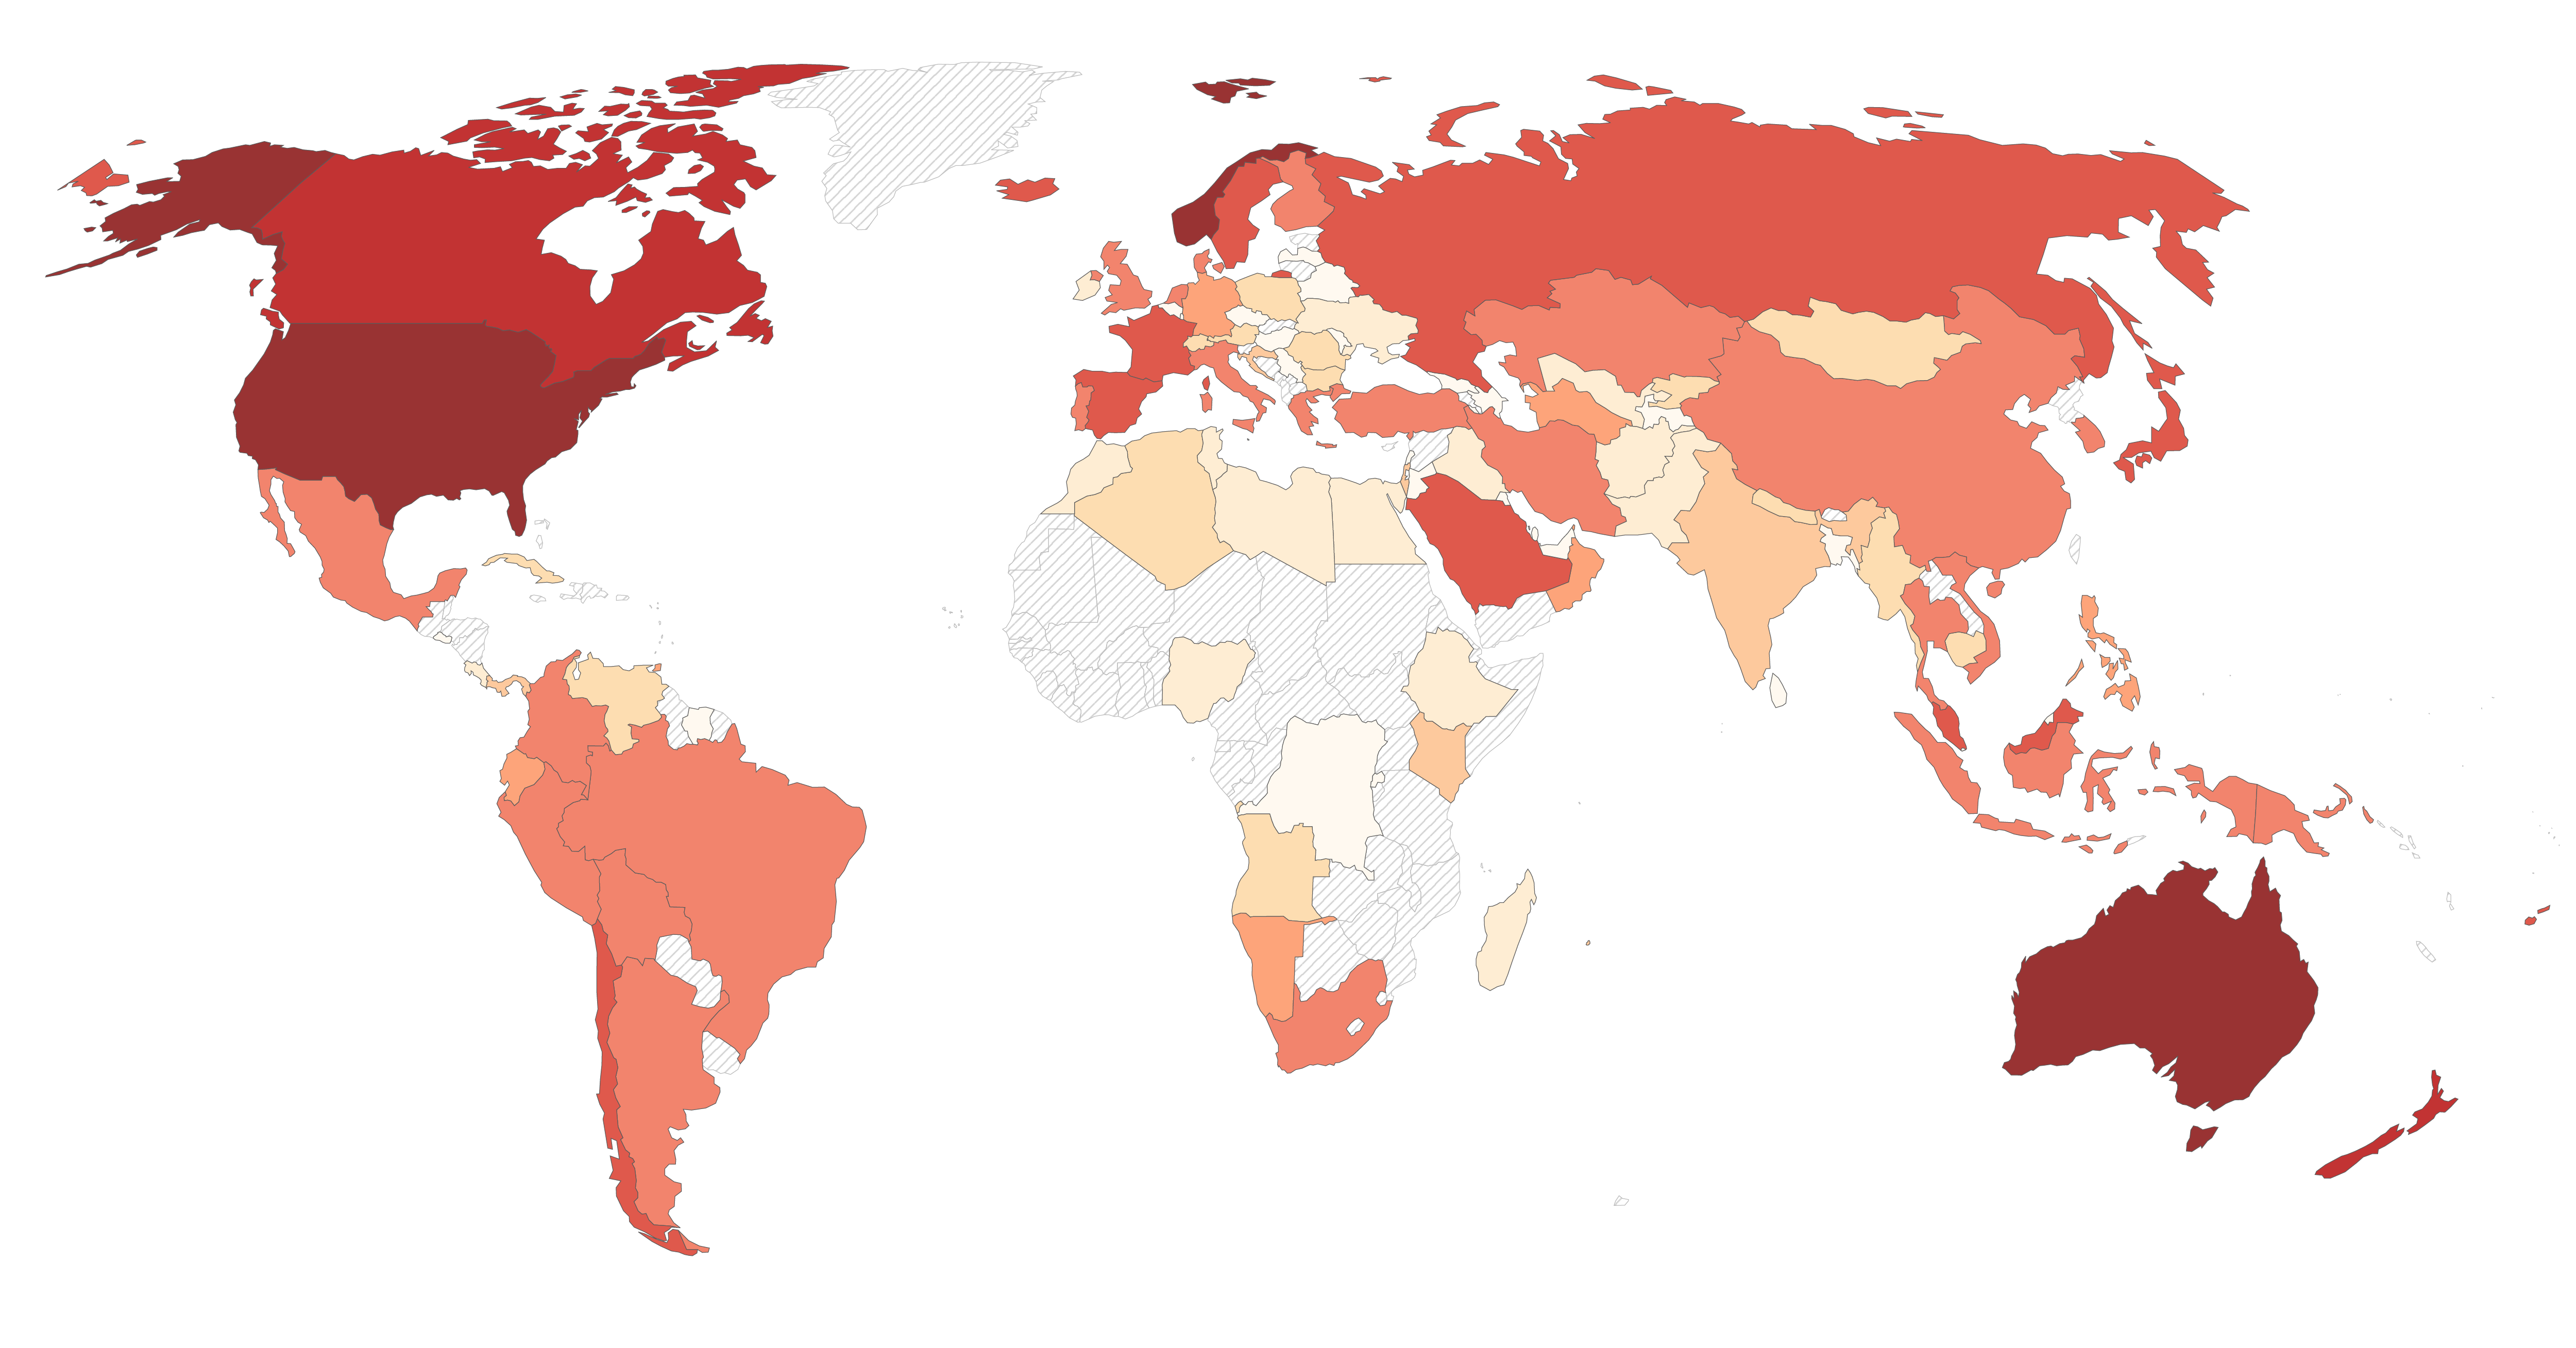
Where in the world do people have the highest CO2 emissions from flying?

Sector by sector: where do global greenhouse gas emissions come from?
Transport, food, and CO₂ emissions
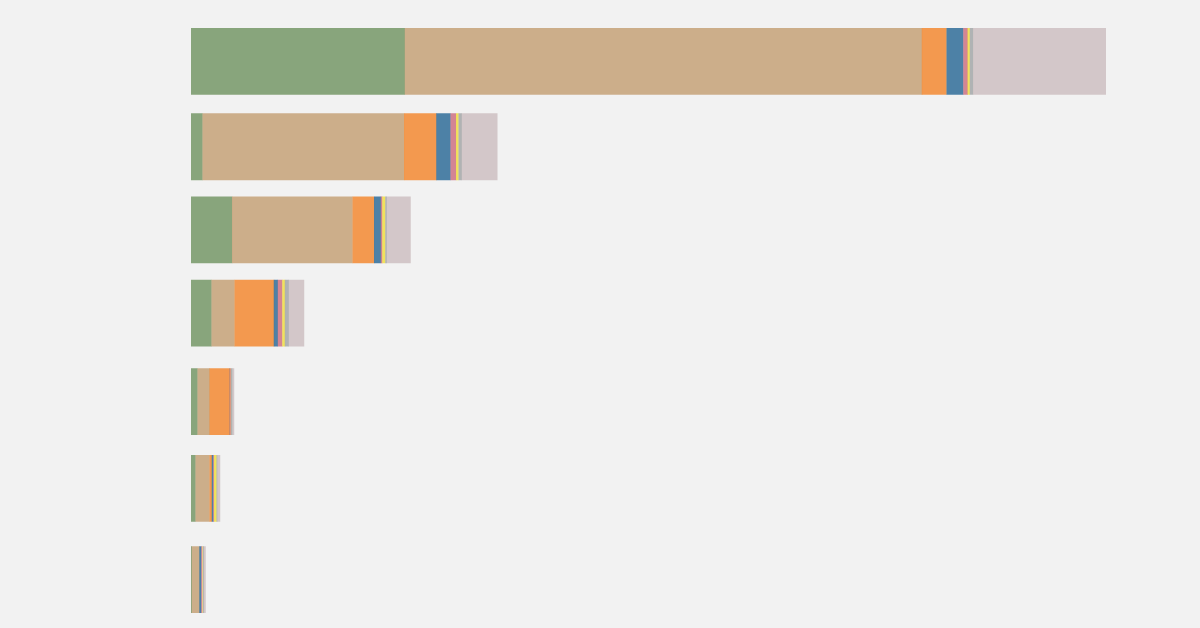
You want to reduce the carbon footprint of your food? Focus on what you eat, not whether your food is local
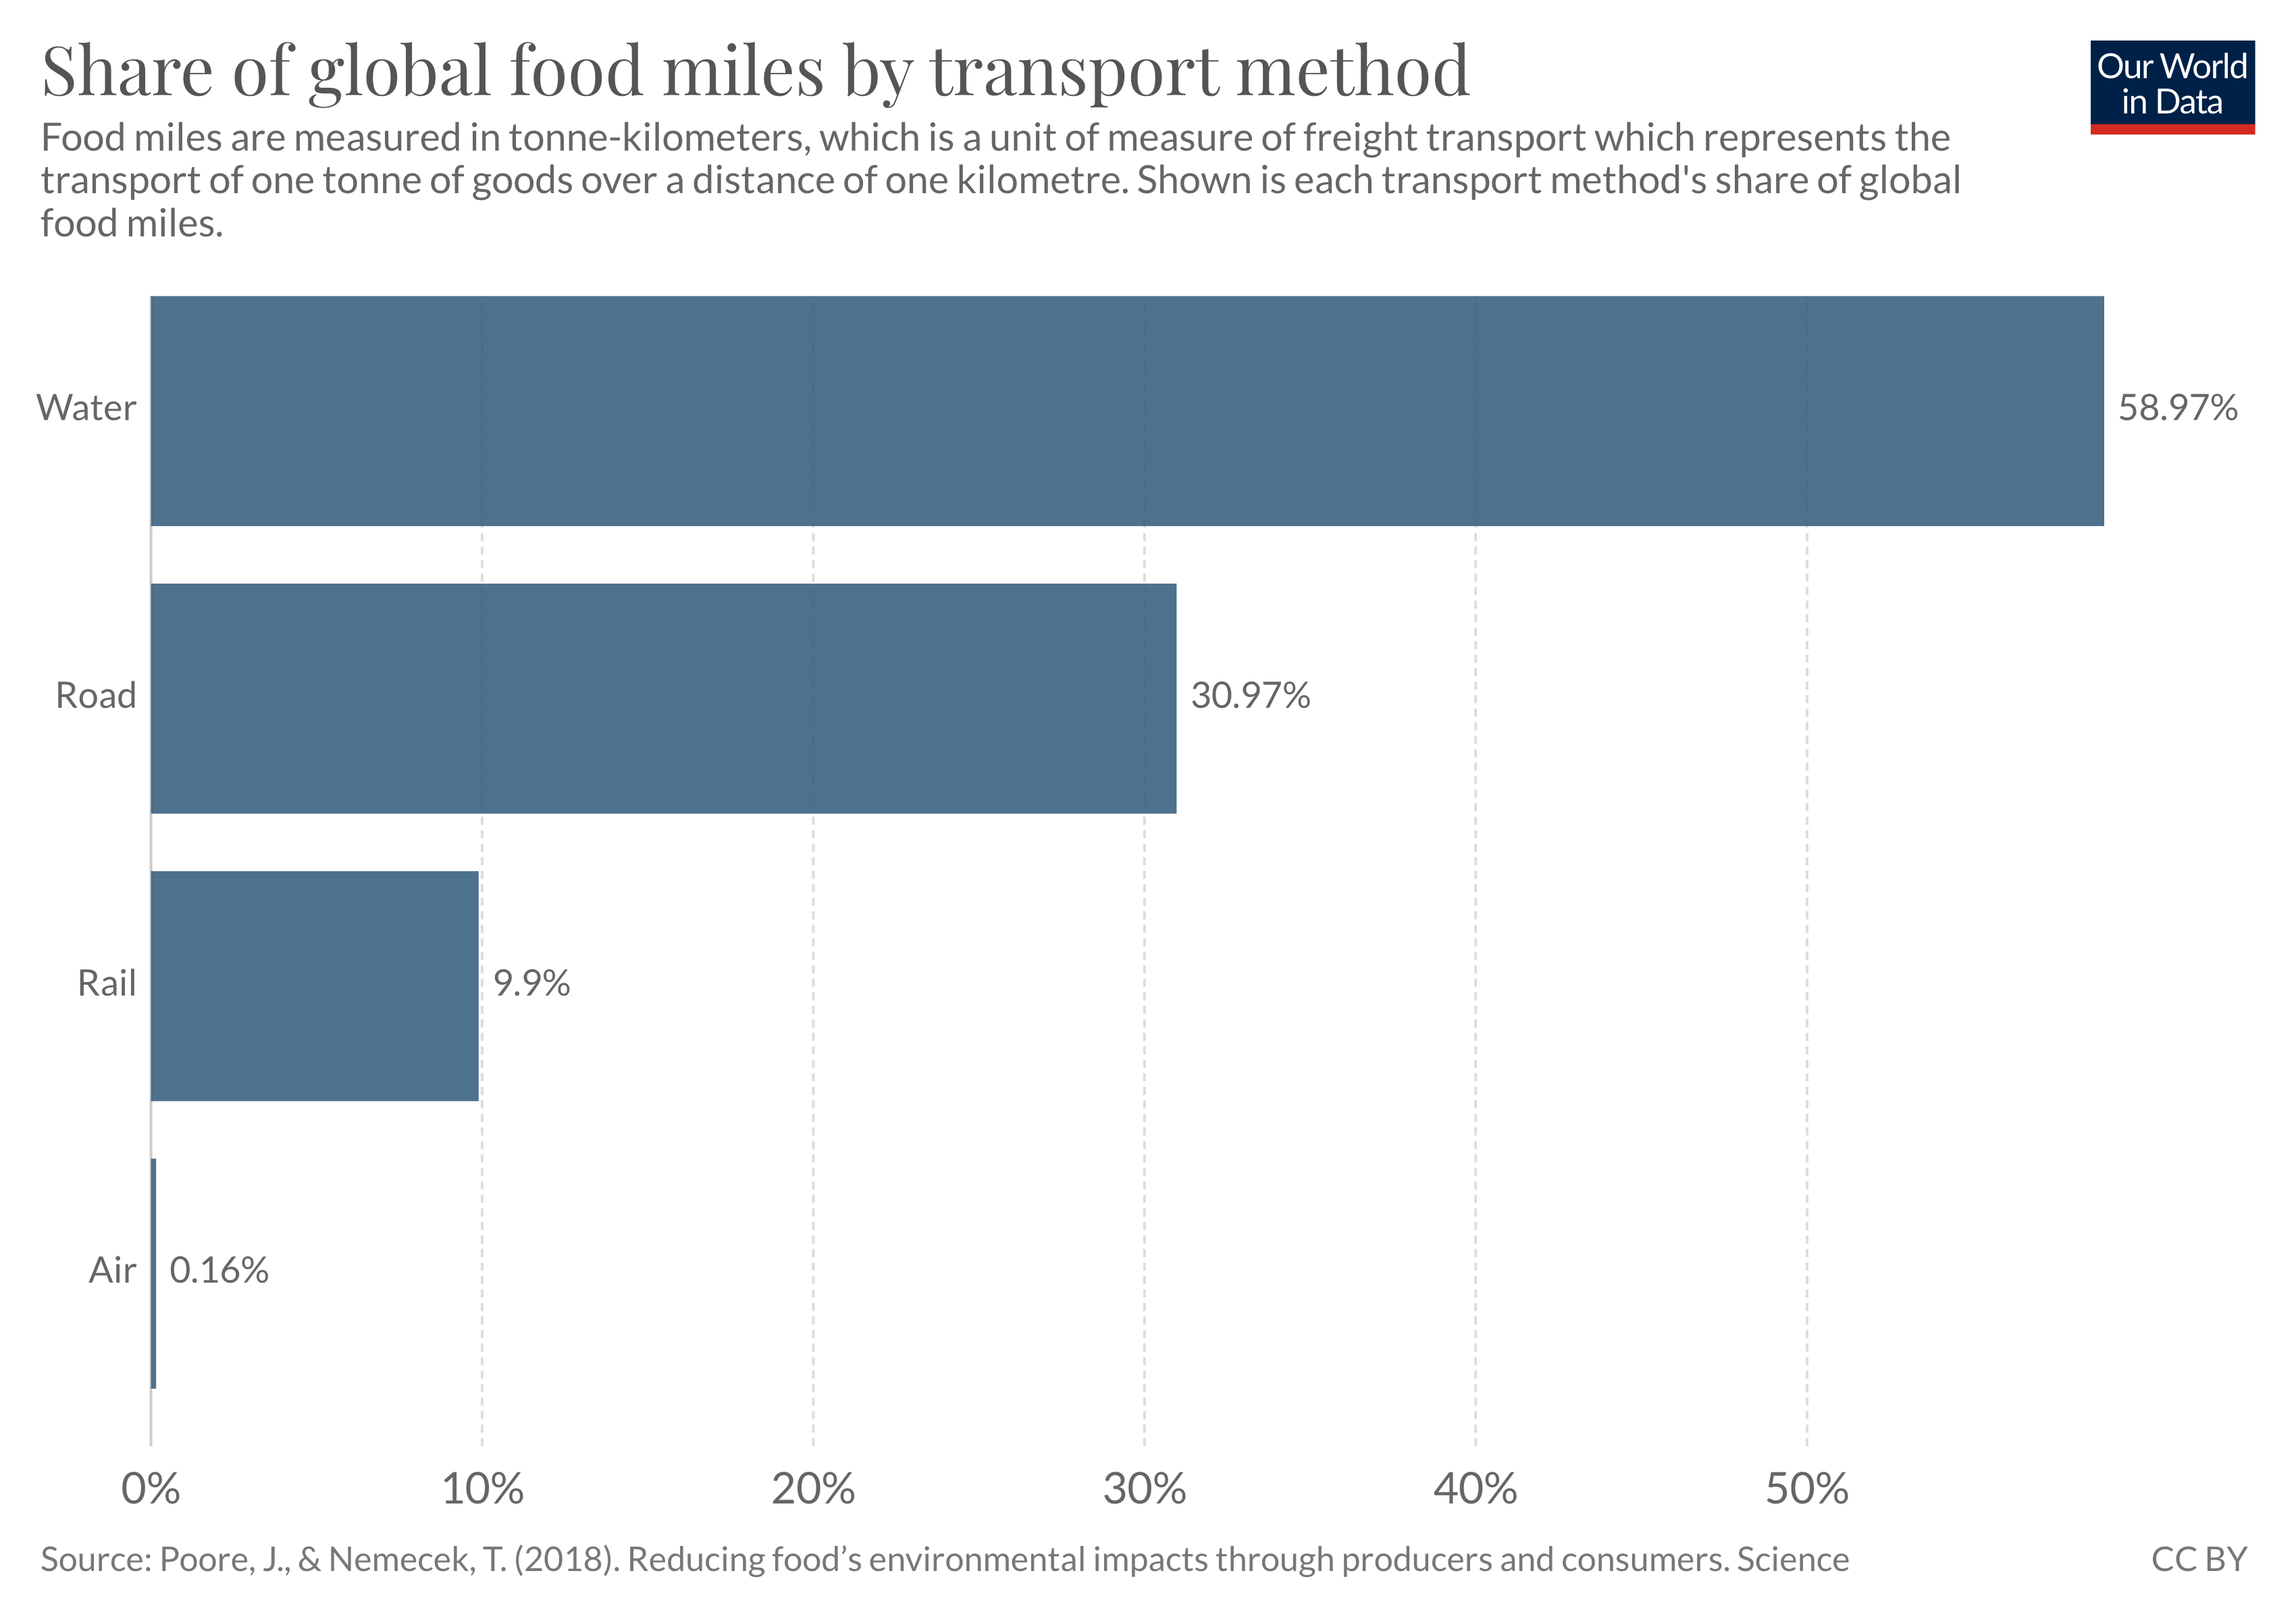
Very little of global food is transported by air; this greatly reduces the climate benefits of eating local
Interactive Charts on Transport
- Air passengers
- Average carbon intensity of new passenger vehicles
- CO₂ emissions from aviation
- CO₂ emissions from domestic air travel
- CO₂ emissions from transport
- Carbon footprint of travel per kilometer
- Energy intensity of transport per passenger-kilometer
- Fuel economy of new passenger vehicles
- Global airline passenger capacity and traffic
- Global airline passengers per year
- Global aviation demand, energy efficiency and CO₂ emissions
- New passenger vehicle registrations by type
- New passenger vehicles by type
- Number of air travel trips per capita
- Number of air travel trips vs. GDP per capita
- Number of new cars sold, by type
- Number of new passenger vehicles by type
- Participation time in travel per day
- Passenger-kilometers by air
- Passenger-kilometers by rail
- Per capita CO₂ emissions from aviation
- Per capita CO₂ emissions from commercial aviation, tourism-adjusted
- Per capita CO₂ emissions from domestic aviation
- Per capita CO₂ emissions from domestic aviation vs. GDP per capita
- Per capita CO₂ emissions from domestic aviation vs. land area
- Per capita CO₂ emissions from international aviation
- Per capita CO₂ emissions from international passenger flights, tourism-adjusted Graver & World Bank
- Per capita CO₂ emissions from transport
- Per capita domestic aviation passenger kilometers
- Per capita international aviation passenger kilometers
- Per capita passenger kilometers from air travel
- Registered vehicles per 1,000 people
- Relative share of passenger kilometers travelled by rail and road
- Share of airline seats filled by passengers
- Share of global CO₂ emissions from aviation
- Share of global CO₂ emissions from international aviation
- Share of global domestic aviation passenger kilometers
- Share of global passenger kilometers from air travel
- Share of global passenger kilometers from international aviation
- Share of new cars sold that are battery-electric and plug-in hybrid
- Share of new passenger vehicles that are battery electric
- Share of new passenger vehicles that are electric or plug-in hybrid
- Share of urban populations with convenient access to public transport
- Tonne-kilometers of air freight
- Total domestic aviation passenger kilometers
- Total passenger kilometers from air travel
- Total passenger kilometers from international aviation
Chart 1 of 47
Cite this work
Our articles and data visualizations rely on work from many different people and organizations. When citing this topic page, please also cite the underlying data sources. This topic page can be cited as:
Hannah Ritchie and Max Roser (2021) - “Transport” Published online at OurWorldInData.org. Retrieved from: 'https://ourworldindata.org/transport' [Online Resource]
@article, title = , journal = , year = , note = >
Reuse this work freely
All visualizations, data, and code produced by Our World in Data are completely open access under the Creative Commons BY license. You have the permission to use, distribute, and reproduce these in any medium, provided the source and authors are credited.
The data produced by third parties and made available by Our World in Data is subject to the license terms from the original third-party authors. We will always indicate the original source of the data in our documentation, so you should always check the license of any such third-party data before use and redistribution.
Our World in Data is free and accessible for everyone.
Help us do this work by making a donation.
Licenses: All visualizations, data, and articles produced by Our World in Data are open access under the Creative Commons BY license. You have permission to use, distribute, and reproduce these in any medium, provided the source and authors are credited. All the software and code that we write is open source and made available via GitHub under the permissive MIT license. All other material, including data produced by third parties and made available by Our World in Data, is subject to the license terms from the original third-party authors.
Please consult our full legal disclaimer.
Our World In Data is a project of the Global Change Data Lab, a registered charity in England and Wales (Charity Number 1186433).


